Hi,all
When I doing a load testing job about JBossperformance/throughput of my JBossAS,
I find that the performance will decreasewith time increase.
So I want to find out what make it like this.Here is my test report.
1.Testing environment:
JBoss version:JBoss5.1.0.GA
Java version:JDK1.5
OS:Windows server 2003
DBMS:Sql server 2005
Testing tool: Apache Jmeter/i have set 50threads and Ramp-Up Period in 30 seconds.
2.I’ve done some JBoss tuning. Here aresome tune changes in my test JBoss.
a)I’ve add some parameters about JVM in thefile %JBOSS_HOME%bin\run.conf.bat
rem # JVM memory allocation pool parameters- modify as appropriate.
set "JAVA_OPTS=-Xms1024M -Xmx1024M-XX:MaxPermSize=256M -XX:NewSize=400M -XX:MaxNewSize=400M-XX:SurvivorRatio=32"
rem #
set -Djava.util.logging.manager=java.util.logging.LogManager-Djava.util.logging.config.file=C:\mcs\config\logging.properties"
b)Here is the logging.properties:
##########################################################
# Default Logging Configuration File
#
# You can use a different file byspecifying a filename
# with the java.util.logging.config.filesystem property.
# For example java-Djava.util.logging.config.file=myfile
############################################################
############################################################
# Global properties
############################################################
# "handlers" specifies a commaseparated list of log Handler
# classes. These handlers will be installed during VM startup.
# Note that these classes must be on thesystem classpath.
# By default we only configure aConsoleHandler, which will only
# show messages at the INFO and abovelevels.
handlers= java.util.logging.ConsoleHandler
# To also add the FileHandler, use thefollowing line instead.
#handlers= java.util.logging.FileHandler,java.util.logging.ConsoleHandler
# Default global logging level.
# This specifies which kinds of events arelogged across
# all loggers. For any given facility this global level
# can be overriden by a facility specificlevel
# Note that the ConsoleHandler also has aseparate level
# setting to limit messages printed to theconsole.
.level= OFF
############################################################
# Handler specific properties.
# Describes specific configuration info forHandlers.
############################################################
# default file output is in user's homedirectory.
java.util.logging.FileHandler.pattern =%h/java%u.log
java.util.logging.FileHandler.limit = 50000
java.util.logging.FileHandler.count = 1
java.util.logging.FileHandler.formatter =java.util.logging.XMLFormatter
# Limit the message that are printed on theconsole to INFO and above.
java.util.logging.ConsoleHandler.level =OFF
java.util.logging.ConsoleHandler.formatter= java.util.logging.SimpleFormatter
############################################################
# Facility specific properties.
# Provides extra control for each logger.
############################################################
# For example, set the com.xyz.foo loggerto only log SEVERE
# messages:
com.xyz.foo.level = SEVERE
com.microsoft.sqlserver.jdbc.internals.SQLServerResultSet= OFF
com.microsoft.sqlserver.jdbc.ResultSet =OFF
com.microsoft.sqlserver.jdbc = OFF
c)System thread pool size
<!-- A Thread pool service -->
<mbean code="org.jboss.util.threadpool.BasicThreadPool"
name="jboss.system:service=ThreadPool">
<attribute name="Name">JBoss SystemThreads</attribute>
<attribute name="ThreadGroupName">SystemThreads</attribute>
<!-- How long a thread will live without any tasks in MS -->
<attribute name="KeepAliveTime">60000</attribute>
<!-- The max number of threads in the pool-->
<attributename="MaximumPoolSize">100</attribute>
<!-- The max number of tasks before the queue is full -->
<attributename="MaximumQueueSize">1000</attribute>
d)Set database pool size
<min-pool-size>100</min-pool-size>
<max-pool-size>300</max-pool-size>
Add parameters above into the *-ds filesunder %JBOSS_HOME%\server\all\deploy
3.Here are some test results pictures below
http://community.jboss.org/servlet/JiveServlet/downloadImage/2-589983-11620/426-446/1.png
1
http://community.jboss.org/servlet/JiveServlet/downloadImage/2-589983-11621/450-376/2.png
2
http://community.jboss.org/servlet/JiveServlet/downloadImage/2-589983-11622/450-269/3.png
3
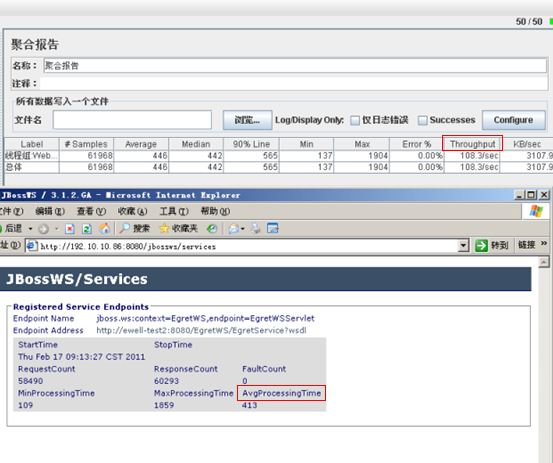
Pic1.You can see, with the time increaseJBossAvgProcessingTime become more and more large finally become stabilized.
And then Throughput become more and moresmall finally become stabilized too.
You can see more about AvgProcessingTimeand Throughput means from PIC2.
Question1:Why the JBoss performanve finally become almost half slow than first?
Question2:Why the RequestCount is less than ResponseCount?
Pic3.This picture tell us,cpu almost aroundat 85% and memory around 42%,
So it can’t caused by hardware.
And who can tell us more about theparameter (c)system thread pool size means?
Anyone can help me? thanks