[Performance Tuning] - jboss 5.1.0: performance drops after one hour and strange GC behaviour
- First Post
- Replies
- Stats
-
Go to
- ----- 2026 -----
- July
- June
- May
- April
- March
- February
- January
- ----- 2025 -----
- December
- November
- October
- September
- August
- July
- June
- May
- April
- March
- February
- January
- ----- 2024 -----
- December
- November
- October
- September
- August
- July
- June
- May
- April
- March
- February
- January
- ----- 2023 -----
- December
- November
- October
- September
- August
- July
- June
- May
- April
- March
- February
- January
- ----- 2022 -----
- December
- November
- October
- September
- August
- July
- June
- May
- April
- March
- February
- January
- ----- 2021 -----
- December
- November
- October
- September
- August
- July
- June
- May
- April
- March
- February
- January
- ----- 2020 -----
- December
- November
- October
- September
- August
- July
- June
- May
- April
- March
- February
- January
- ----- 2019 -----
- December
- November
- October
- September
- August
- July
- June
- May
- April
- March
- February
- January
- ----- 2018 -----
- December
- November
- October
- September
- August
- July
- June
- May
- April
- March
- February
- January
- ----- 2017 -----
- December
- November
- October
- September
- August
- July
- June
- May
- April
- March
- February
- January
- ----- 2016 -----
- December
- November
- October
- September
- August
- July
- June
- May
- April
- March
- February
- January
- ----- 2015 -----
- December
- November
- October
- September
- August
- July
- June
- May
- April
- March
- February
- January
- ----- 2014 -----
- December
- November
- October
- September
- August
- July
- June
- May
- April
- March
- February
- January
- ----- 2013 -----
- December
- November
- October
- September
- August
- July
- June
- May
- April
- March
- February
- January
- ----- 2012 -----
- December
- November
- October
- September
- August
- July
- June
- May
- April
- March
- February
- January
- ----- 2011 -----
- December
- November
- October
- September
- August
- July
- June
- May
- April
- March
- February
- January
- ----- 2010 -----
- December
- November
- October
- September
- August
- July
- June
- May
- April
- March
- February
- January
- ----- 2009 -----
- December
- November
- October
- September
- August
- July
- June
- May
- April
- March
- February
- January
- ----- 2008 -----
- December
- November
- October
- September
- August
- July
- June
- May
- April
- March
- February
- January
- ----- 2007 -----
- December
- November
- October
- September
- August
- July
- June
- May
- April
- March
- February
- January
- ----- 2006 -----
- December
- November
- October
- September
- August
- July

Matt Darwin [https://community.jboss.org/people/mattdarwin] created the discussion
"jboss 5.1.0: performance drops after one hour and strange GC behaviour"
To view the discussion, visit: https://community.jboss.org/message/832880#832880
--------------------------------------------------------------
We upgraded our software from jboss 4.0.5GA to 5.1.0GA and noticed that after one hour or
so (or 90 minutes in some cases) performance drops dramatically.
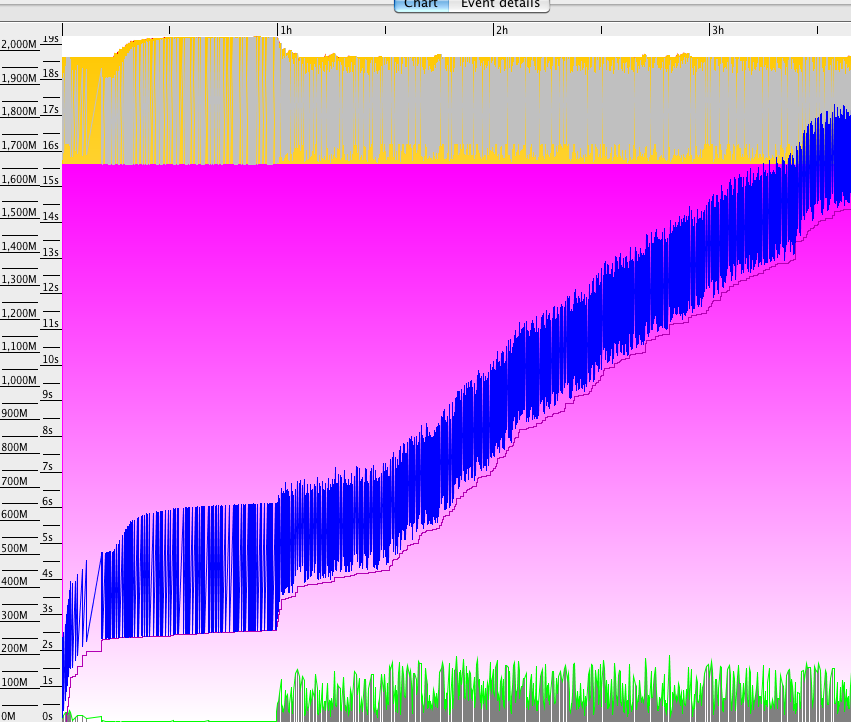
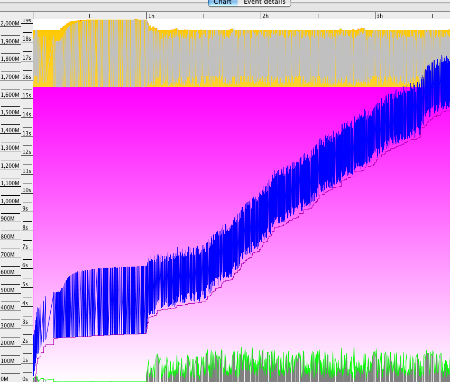
At the same moment, the garbage collector logs show minor garbage collection times jumping
from 0.01s to ~1.5s, with the amount of the heap being cleared each time reducing from
~400MB before to ~300MB after. (see GC viewer graph 1)
https://community.jboss.org/servlet/JiveServlet/showImage/2-832880-21301/...
https://community.jboss.org/servlet/JiveServlet/downloadImage/2-832880-21...
We think these are both symptoms of the the same underlying root cause.
jvm settings are:
-server -Xms2048m -Xmx2048m -XX:NewSize=384m -XX:MaxNewSize=384m -XX:SurvivorRatio=4
-XX:MinHeapFreeRatio=11 -XX:PermSize=80m -verbose:gc -XX:+PrintGCDateStamps
-XX:+PrintGCDetails -XX:+DisableExplicitGC -Djava.awt.headless=TRUE
-DUseSunHttpHandler=TRUE -Dsun.net.client.defaultConnectTimeout=25000
-Dsun.net.client.defaultReadTimeout=50000 -Dfile.encoding=UTF-8
-Dvzzv.log.dir=${ercorebatch.log.dir} -Xloggc:${ercorebatch.log.dir}/gc.log
-Duser.language=it -Duser.region=IT -Duser.country=IT -DVFjavaWL=er.core.it
The production environment is T5220 or T2000 hardware, with 32 bit SPARC, running a
Solaris 10 virtual machine. jboss 5.0.1.GA, java 1.6.0_17
We set up a test environment consisting of 2 identical boxes, running the same software
but one using jboss 4.0.5GA and one using jboss 5.0.1.GA. They are VMWare VMs running on
a HP ProLiant DL560 Gen8 with 4 x 2.2GHz Intel Xeon CPU E5-4620 and 64GB RAM. Guest VMs
are 4 vCPU, 4096MB RAM, CentOS 6.4.
We found that we could easily reproduce the problem in our environment. The box which was
running on 4.0.5 ran fine, but on jboss 5.0.1GA we saw the same strange GC behaviour.
Performance can't easily be tested in our environment since we don't have the same
amount of load as production.
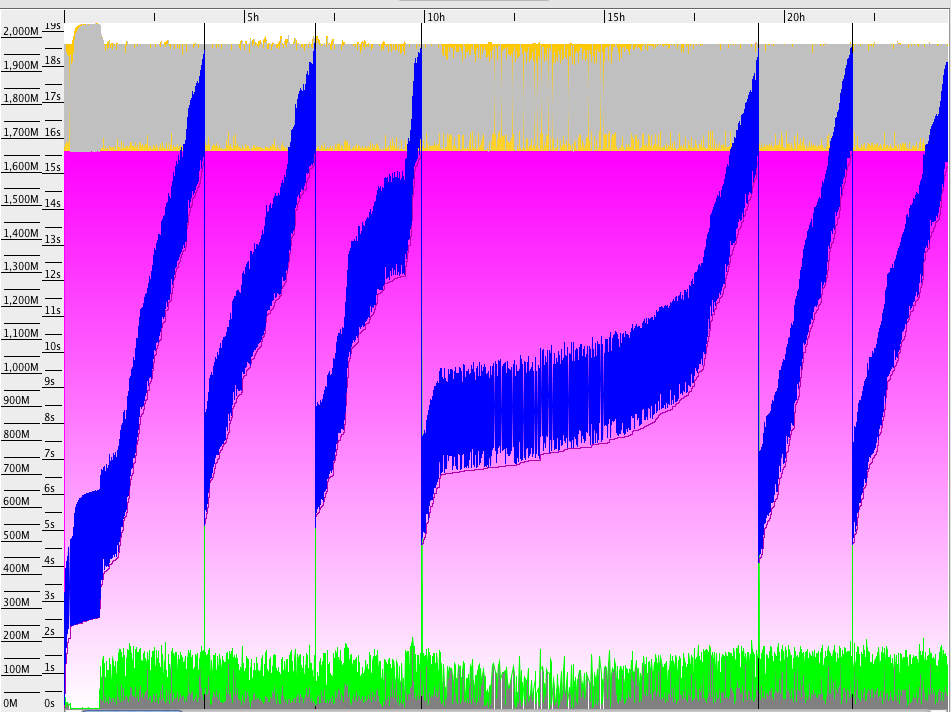
We don't think it's a memory leak, since after each major GC, the used heap size
returns to the same size:
https://community.jboss.org/servlet/JiveServlet/showImage/2-832880-21302/...
https://community.jboss.org/servlet/JiveServlet/downloadImage/2-832880-21...
Analysing heap dumps taken pre- and post-apocalypse, we discovered the number of the
following objects was different:
org.jboss.virtual.plugins.context.file.FileSystemContext
during the first hour, there are about 8 of them, and after the apocalypse hits, we see
between 100 and 800.
Other than that, the heap dumps look quite similar, and the top objects are either java or
jboss objects (ie no application classes)
Setting -Djboss.vfs.forceVfsJar=true on our test environment fixed the problem (ie the
strange GC behaviour disappeared) but when applied in production, both the strange GC
pattern and the performance problem remained - although the GC times didn't increase
so much (to 0.3 seconds rather than 1.5 seconds).
In our test environment, we then deployed the same software in jboss 5.1.0 and found the
same behaviour as with 5.0.1.
So the conclusions at this point are that there is something happening in jboss 5.x around
the 60 / 90 minute mark which has an impact on both garbage collection and performance.
--------------------------------------------------------------
Reply to this message by going to Community
[https://community.jboss.org/message/832880#832880]
Start a new discussion in Performance Tuning at Community
[https://community.jboss.org/choose-container!input.jspa?contentType=1&...]
Attachments:
- attachment.html (text/html — 10.0 KB)
4713
days inactive
4713
days old
0 comments
1 participants
tags (0)
participants (1)
-
 Matt Darwin